The Raff Channel is a linear regression with evenly spaced trend lines above and below. The width of the channel is based on the high or low that is the furthest from the linear regression. If prices continue to rise within the channel, the trend is up. An uptrend reverses when the price breaks below the channel extension. When prices decline within the channel, the trend is down. Similarly, a downtrend reverses when price the breaks above the channel extension.
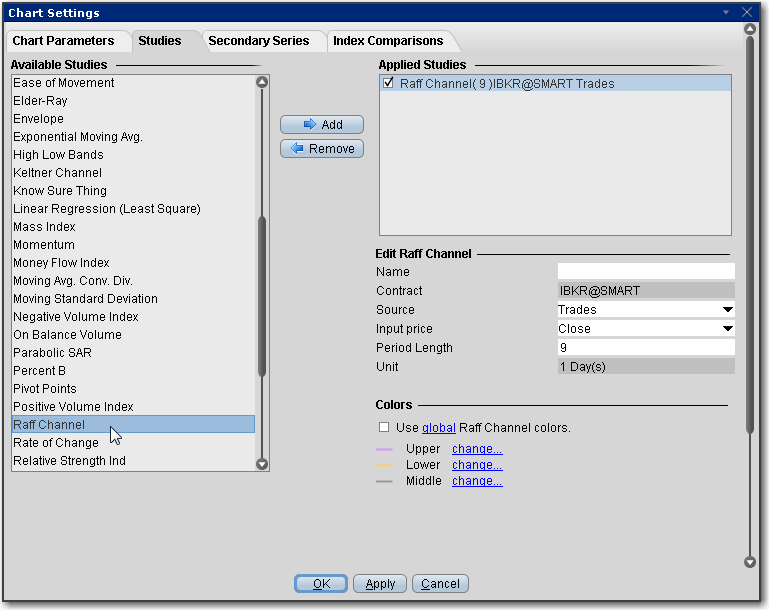
To apply a Raff Channel Indicator
Once the study is defined, you can elect to uncheck/check to remove and add the study to your chart.