The Relative Vigor Index measures the conviction of a recent price action and the likelihood that it will continue by comparing the positioning of a security's closing price relative to its price range. The result is smoothed by calculating an exponential moving average of the values. It's similar to the stochastic oscillator, but the vigor index compares the close relative to the open rather than relative to the low. The value will likely grow as the bullish trend gains momentum, since a security's closing price tends to be at the top of the range while the open is near the low of the day.
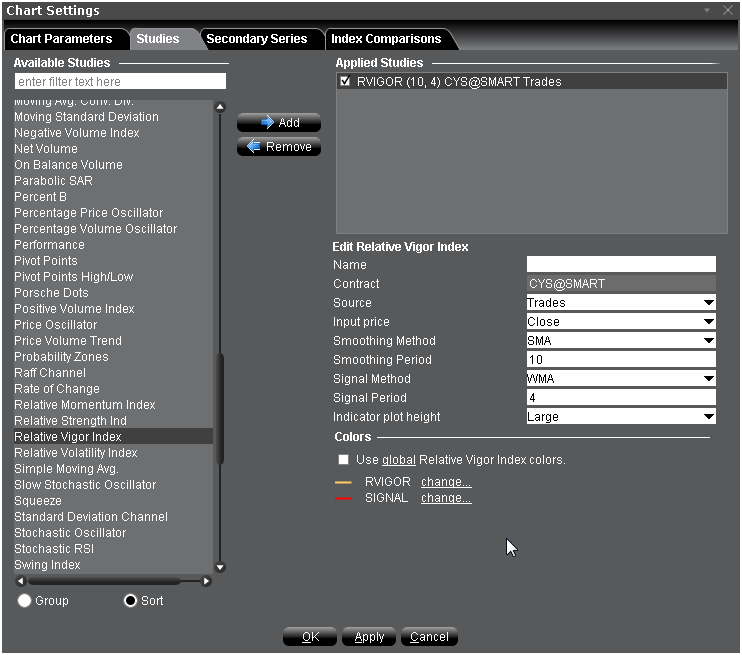
To apply a Relative Vigor Index
Once the study is defined, you can elect to uncheck/check to remove and add the study to your chart.