The Relative Volatility Index (RVI) is similar to the Relative Strength Index (RSI) index. Both measure the direction of volatility, but RVI uses the standard deviation of price changes in its calculations, while RSI uses the absolute price changes. The RVI is best used as a confirmation indicator to other momentum and/or trend-following indicators.
To apply a Relative Volatility Index Indicator
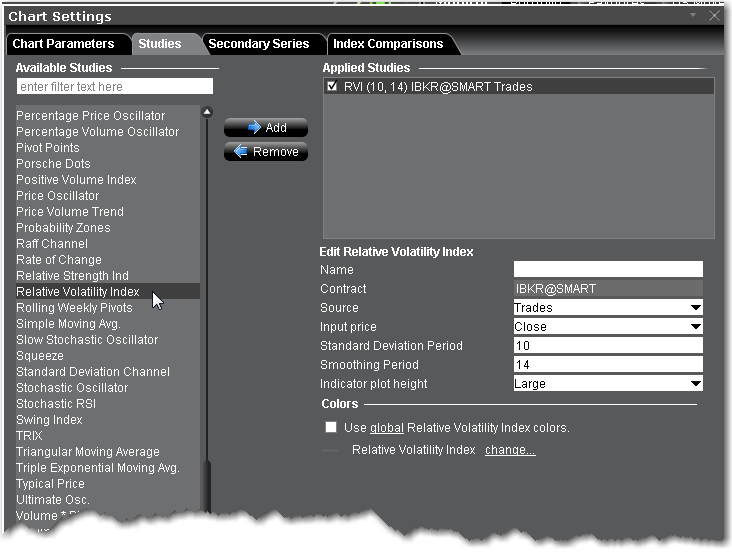
Once the study is defined, you can elect to uncheck/check to remove and add the study to your chart.