Grab and move the chart within its frame to view different time and price areas of the chart. Repositioning the chart results in a snapshot view of the chart with locked data. The chart must be unlocked to reestablish realtime price updates.
To reposition a chart
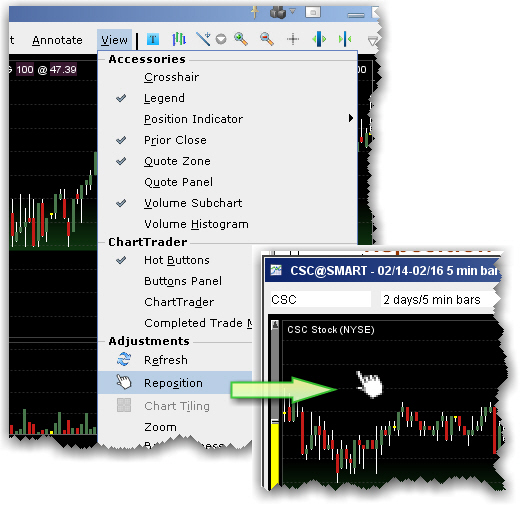
Within a chart, use the View menu to select Reposition. The cursor changes to a pointing hand.
Move this cursor to an area in the chart you want to move, and click the mouse. The cursor changes to the “move” icon.
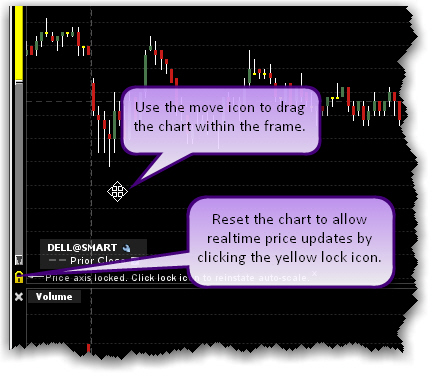
Keeping the mouse key depressed, slide the chart around to reposition. The vertical sliders and price axis adjust according.
Release the mouse key to disable Reposition mode.
To resume price updates
Click the yellow lock on the price axis that signifies snapshot mode.