Standard deviation channels are plotted at a set number of standard deviations around a linear regression line. They can be used in swing trading and in detecting changes in momentum.
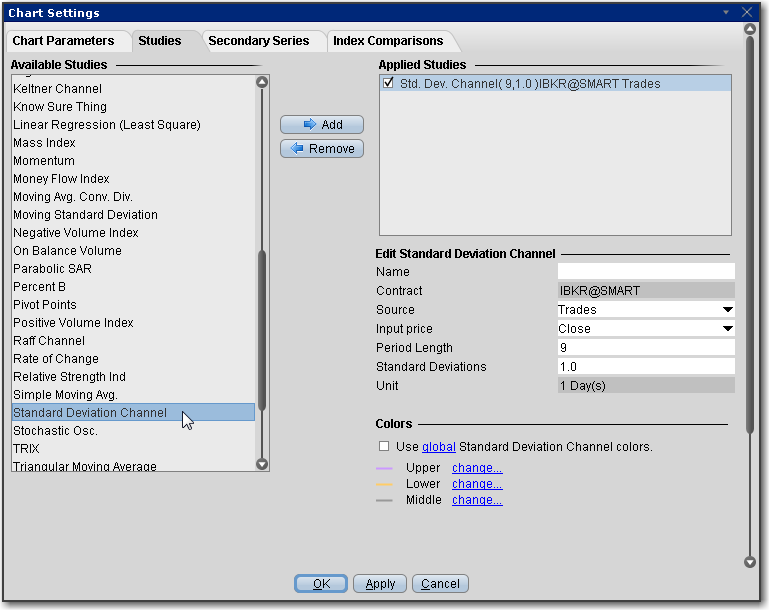
To apply a Standard Deviation Channel Indicator
Once the study is defined, you can elect to uncheck/check to remove and add the study to your chart.