The Swing Index tries to determine the real strength and direction of the market by comparing the relationships between the high, low and close prices of a stock.
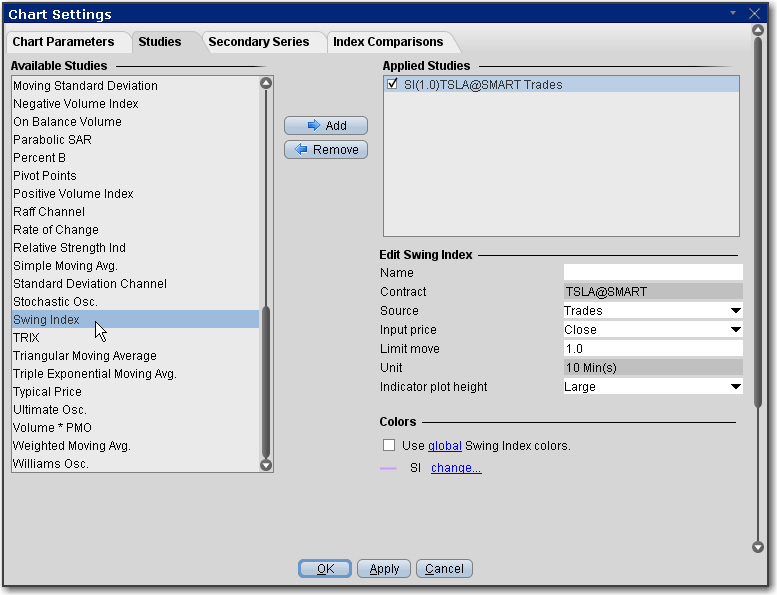
To apply a Swing Index Indicator
Once the study is defined, you can elect to uncheck/check to remove and add the study to your chart.