Open topic with navigation
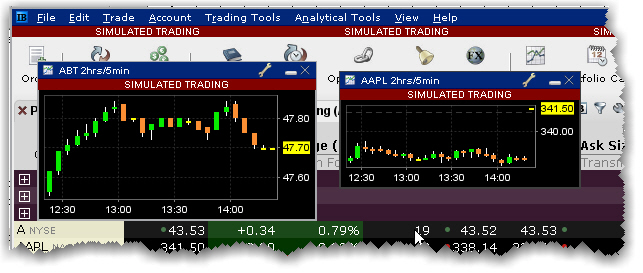
Thumbnails are small floating charts that provide at-a-glance tracking.
To create a thumbnail chart
The small chart can be moved to any area of your desktop, and can be reduced or enlarged by grabbing and dragging one of sides.
Copyright