The Triangular Moving Average is basically a double-smoothed Simple Moving Average that gives more weight to the middle section of the data interval. The TMA has a significant lag to current prices and is not well-suited to fast moving markets.
TMA = SUM (SMA values)/ N Where N = the number of periods.
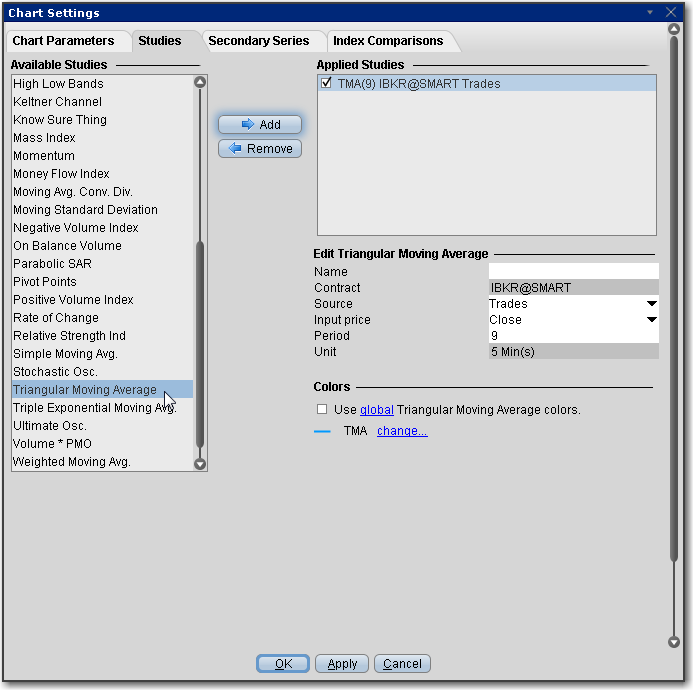
To apply a Triangular Moving Average Indicator
Once the study is defined, you can elect to uncheck/check to remove and add the study to your chart.