TRIX is a momentum oscillator that displays the percent rate of change of a triple exponentially smoothed moving average. TRIX is designed to filter out insignificant price movements with its triple smoothing. TRIX generates signals similar to MACD, and a signal line can be applied to look for signal line crossovers. A directional bias can be determined with the absolute level. Bullish and bearish divergences can be used to anticipate reversals.
To apply a TRIX Indicator
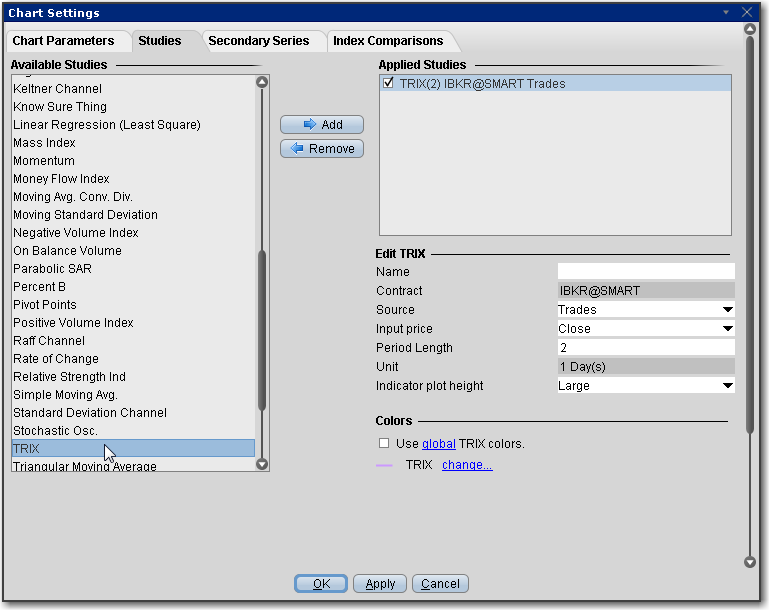
Once the study is defined, you can elect to uncheck/check to remove and add the study to your chart.