The True Strength Index is designed to show trend direction and overbought/oversold conditions, and uses moving averages of the underlying momentum of a financial instrument. Momentum is considered a leading indicator of price movement, and a moving average characteristically lags behind price. The TSI combines these two characteristics to create an indication of price and direction more in sync with market turns than either just momentum or just the moving average.
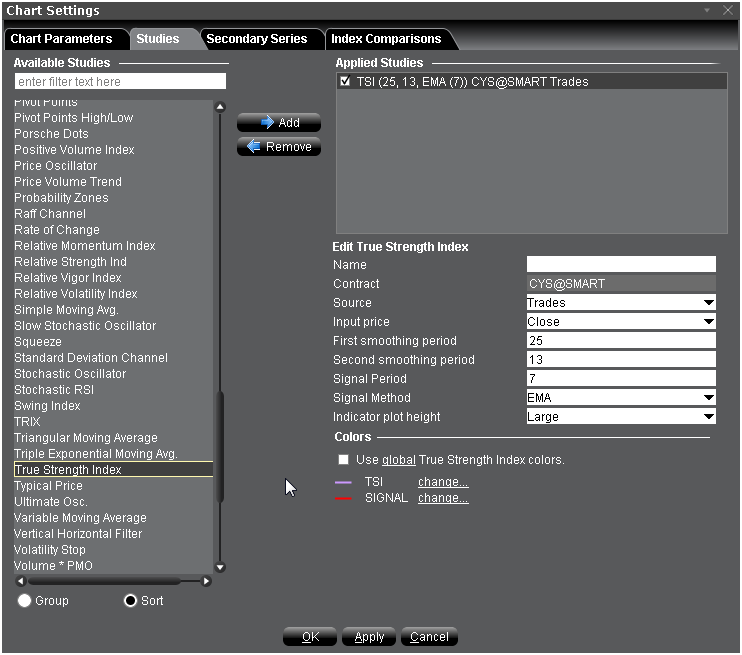
To apply a True Strength Index
Once the study is defined, you can elect to uncheck/check to remove and add the study to your chart.