You are here: Technical Analytics > Chart Indicators > Typical Price Indicator

Typical Price Indicator

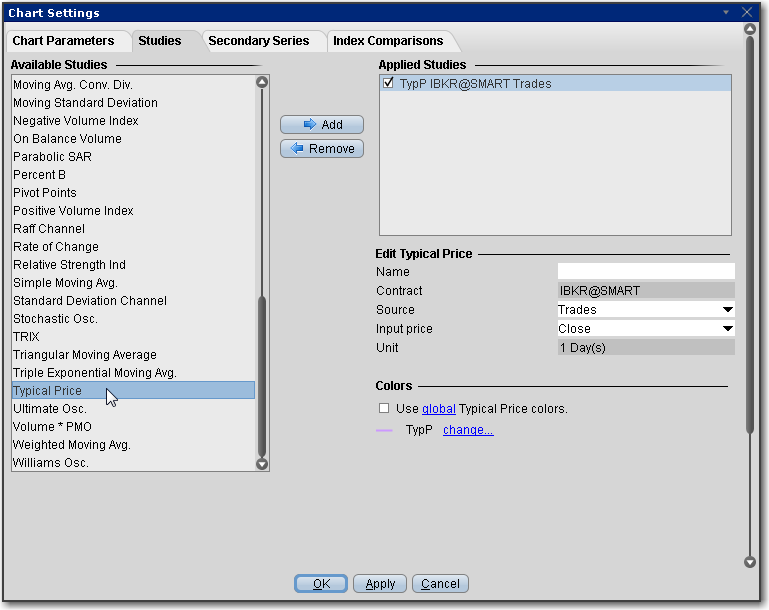
Typical price, calculated as (High Low Close) / 3, is a useful filter for moving average systems.

To apply a Typical Price Indicator

  1. From within a chart, from the Edit menu select Studies.
  2. Choose Typical Price and click Add to add the study to the Applied Studies group.
  3. Complete parameters as necessary.

Once the study is defined, you can elect to uncheck/check to remove and add the study to your chart.