This is an exponential moving average that adjusts its smoothing constant on the basis of market volatility. Its sensitivity grows as long as the volatility of the data increases. The performance of this exponential moving average is improved by using a Volatility Index (VI) to adjust the smoothing period as market conditions change.
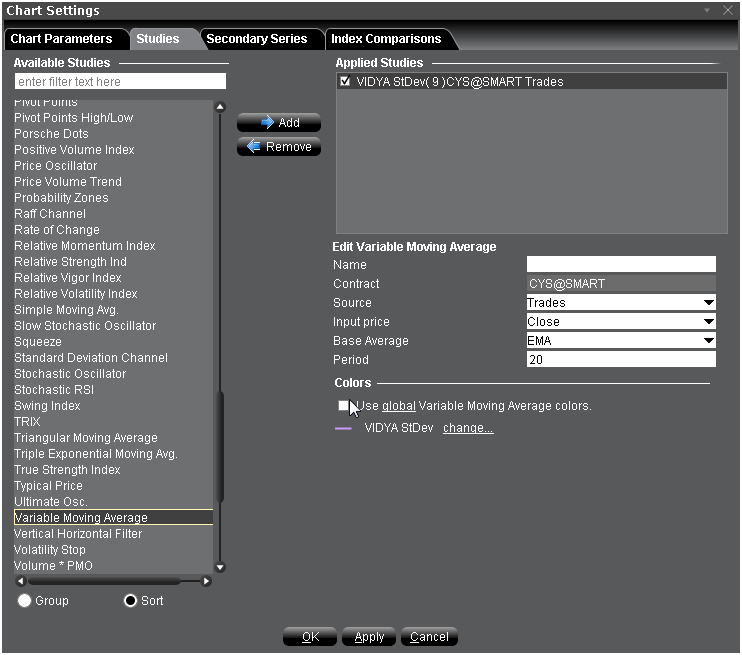
To apply a Variable Moving Average Indicator
Once the study is defined, you can elect to uncheck/check to remove and add the study to your chart.