The Vertical Horizontal Filter determines whether prices are in a trending phase or a trading range or congestion phase. Trend-following indicators such as the MACD and moving averages are excellent in trending markets, but may generate multiple conflicting trades during trading range or congestion periods, while oscillators such as the RSI and stochastics work well when prices fluctuate within a trading range, but they almost always recommend closing positions prematurely during trending markets. The Vertical Horizontal Filter indicator attempts to determine the "trendiness" of prices to help a trader decide which of these indicator types to use.
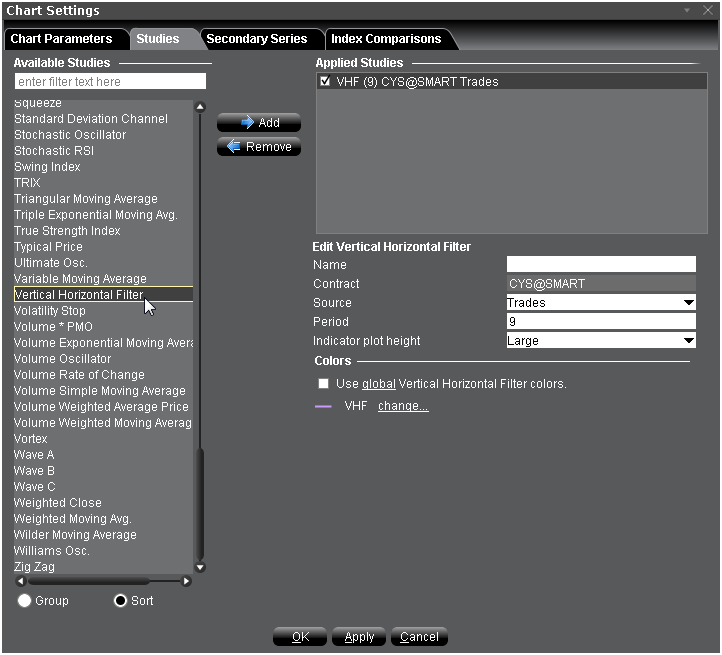
To apply a Vertical Horizontal Filter Indicator
Once the study is defined, you can elect to uncheck/check to remove and add the study to your chart.