The Volatility Stop Indicator helps define the current trend. This indicator plots a red line above the price bars when a downward trend is detected, and a blue line below the bars when an upward trend is detected. These lines are commonly used as trailing stops, and this indicator is commonly used as an exit tool rather than an entry technique. When price crosses the VSTOP value, the trend reverses and VSTOP moves to the other side of the price.
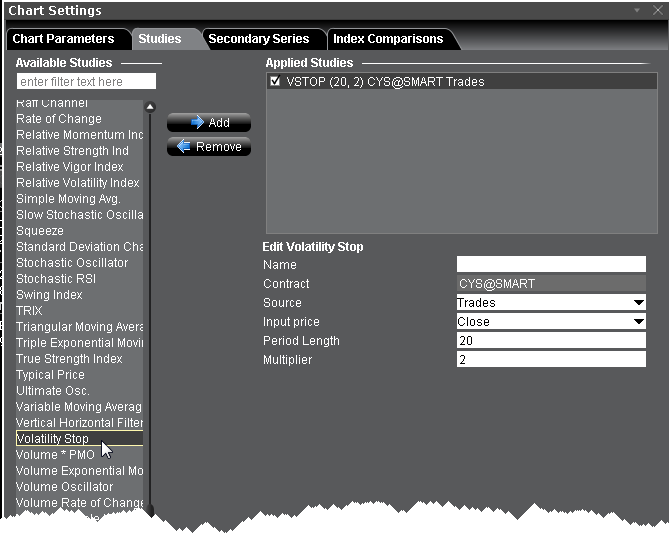
To apply a Volatility Stop Indicator