A two-line oscillator comprising an uptrend line (VI+) and a downtrend line (VI-). Used to spot trend reversals and confirm current trends. An uptrend or buy signal occurs when VI+ crosses above VI-. A downtrend or sell signal occurs when VI- crosses above VI+.
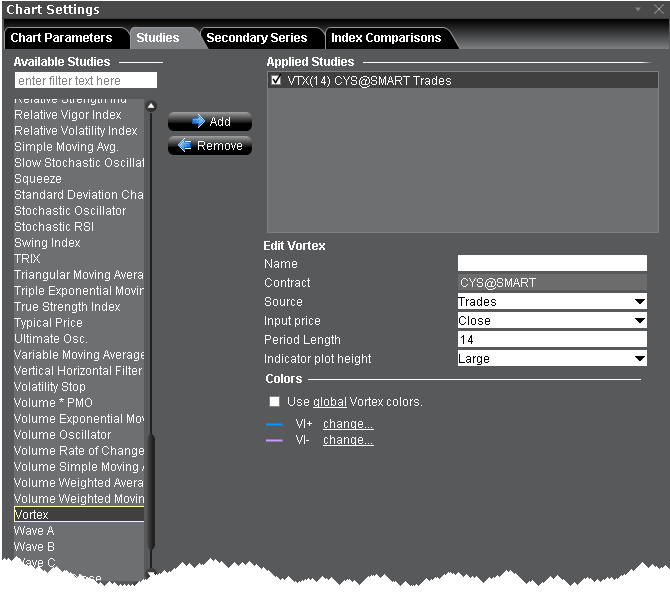
To apply a Vortex Indicator
Once the study is defined, you can elect to uncheck/check to remove and add the study to your chart.