The Zig Zag is a series of trendlines that connect the tops and bottoms of significant prices. Connection criteria is defined using the indicator's Minimum Change or Percent Change parameter.
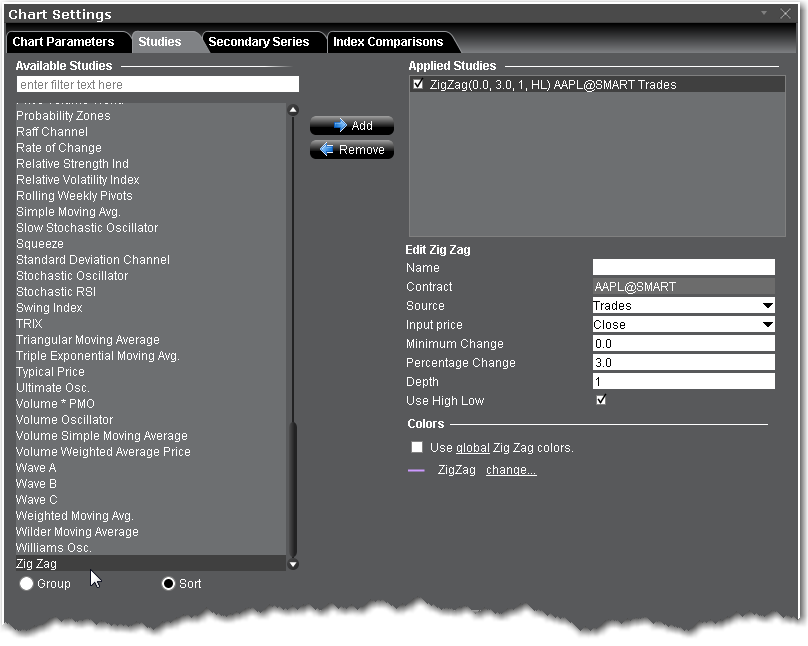
To apply a Zig Zag Indicator
Once the study is defined, you can elect to uncheck/check to remove and add the study to your chart.