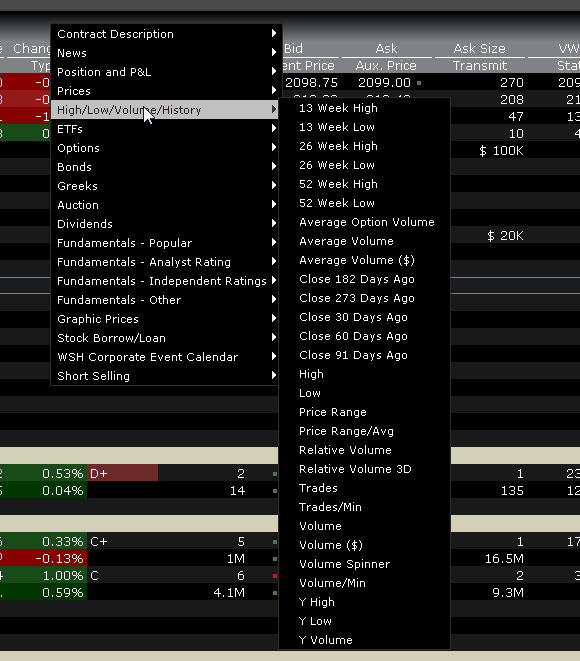
To add High/Low/Volume/History columns to the Quote Monitor or other window, hold your mouse over an existing Market Data column heading and click the green "+" sign to insert column. From the displayed list select High/Low/Volume/History and click the field to add. To add multiple fields, use the right-click menu from the column header and select Customize Layout.
|
Column Name
|
Description
|
|
13 week low
|
The lowest price for the past 13 weeks.
|
|
13 week high
|
The highest price for the past 13 weeks.
|
|
26 week low
|
The lowest price for the past 26 weeks.
|
|
26 week high
|
The highest price for the past 26 weeks.
|
|
52 week low
|
The lowest price for the past 52 weeks.
|
|
52 week high
|
The highest price for the past 52 weeks.
|
| Average Option Volume |
|
|
Average Volume
|
The average daily trading volume over 90 days (multiply this value times 100).
|
| Average Volume (%) |
The average daily trading volume over 90 days (multiply this value times 100) shown as a percentage. |
| Close 182 Days Ago |
Shows the closing price as of the last trading date 182 calendar days ago. Mouse over the value to see actual date of the data. Value is adjusted for corporate actions. |
| Close 273 Days Ago |
Shows the closing price as of the last trading date 273 calendar days ago. Mouse over the value to see actual date of the data. Value is adjusted for corporate actions. |
| Close 30 Days Ago |
Shows the closing price as of the last trading date 30 calendar days ago. Mouse over the value to see actual date of the data. Value is adjusted for corporate actions. |
| Close 60 Days Ago |
Shows the closing price as of the last trading date 60 calendar days ago. Mouse over the value to see actual date of the data. Value is adjusted for corporate actions. |
| Close 91 Days Ago |
Shows the closing price as of the last trading date 91 calendar days ago. Mouse over the value to see actual date of the data. Value is adjusted for corporate actions. |
|
High
|
High price for the day for the selected contract.
|
|
Low
|
Low price for the day for the selected contract.
|
| Price Range |
The price range change: (Max(High, Close) - Min (Low, Close)) |
| Price Range/Avg |
Ratio of the price range (see above) divided by the historical volatility of the contract. |
|
Relative Volume
|
Requires a subscription to eSignal market data. Compares today’s volume with volume from the previous trading day. Indicator grows toward the right as today’s volume increases.
|
|
Relative Volume 3D
|
Requires a subscription to eSignal market data. Compares today’s volume with volume from the previous trading day. Indicator grows toward the right as today’s volume increases.
|
| Trades |
Trade count for the day. |
| Trades/Min |
Trade count per minute. |
|
Volume
|
Trading volume for the day for the selected contract.
|
| Volume (&) |
Trading volume for the day in USD. |
|
Volume Spinner
|
A graphic representation of volume activity, where a blue bar representing 10,000 shares moves across the field from left to right. The faster the bar moves the higher the trading volume. A temporary color change indicates that the last sale was greater than 10,000 shares.
|
| Volume/Min |
Trading volume per minute. |
|
Y High
|
Requires a subscription to eSignal market data. The highest price from the previous trading day.
|
|
Y Low
|
Requires a subscription to eSignal market data. The lowest price from the previous trading day.
|
|
Y Volume
|
Requires a subscription to eSignal market data. The trading volume from the previous trading day.
|