You can define parameters to display a real-time line or bar chart for all supported contracts.
Note: Charts are not supported for mutual funds.
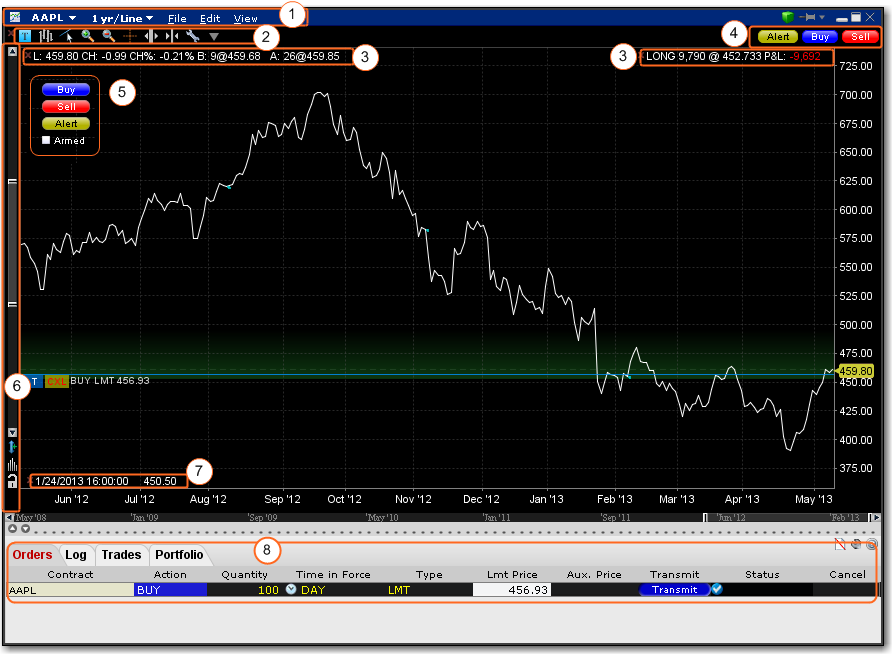
Some of the features of a real-time chart are captured in the above image.
Chart Dashboard/Menu allows you to quickly change the underlying, time period and chart display type and Save Templates (File menu) access Chart Parameters, Studies, and Global Configuration (Edit menu) and easily control hide/display attributes of the chart's components (View menu)
Chart Toolbar - Provides quick-click access to add commentary, edit the chart, zoom in and out, change the cursor to a crosshair, increase or decrease the bar width for a bar chart, and open Global Configuration.
The customizable Quote Zone makes relevant data immediately visible on the chart. To add/remove fields from the Quote Zone, right-click and select Configure Quote Zone.
Action Buttons - Click a button to arm the cursor with the selected function. Click in the chart at the desired price level to create a price alert, sell order or buy order at the selected price. The order displays on the chart and in the ChartTrader panel if you have that opened (via Chart Parameters).
Vertical Scrollbar allows you to quickly increase or decrease the visible price range. Once you use the scrollbar, the price update is locked and you must unlock using the price icon for real-time updates. The blue arrow icon allows you to add a degree of vertical buffer to the chart with each click.
The Bar Details Zone provides detailed information for a specific bar in the chart. We have displayed it for information only, since the image depicts a line chart.
If enabled, the ChartTrader displays once you have created an order using the Buy or Sell hot buttons. Enable via the ChartTrader checkbox in the Additional Data and Features section of the Chart Parameters window.
To create a chart