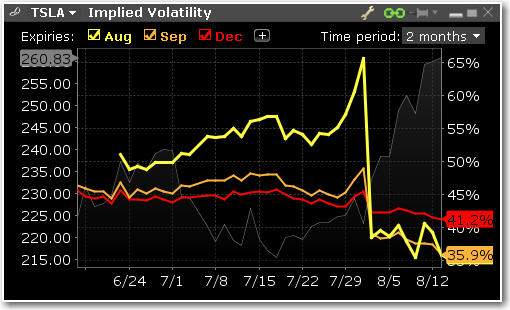
Implied Volatility Window
This displays the measure of anticipated volatility of the stock using the prevailing option premium. The plot allows the user to display the IV reading for as many or as few of the available last trading days. Each is color-coded with the reading for implied volatility measured on the right axis and the stock price is traced using the grey line. This look-back view of IV can be plotted for 1 week, one, two and six months, one year or a custom period. The user may be able to immediately tell from the readings whether or not implied volatility is relatively high in any given month, possibly caused by expected earnings announcements or uncertainty over possible changes to dividend payments.
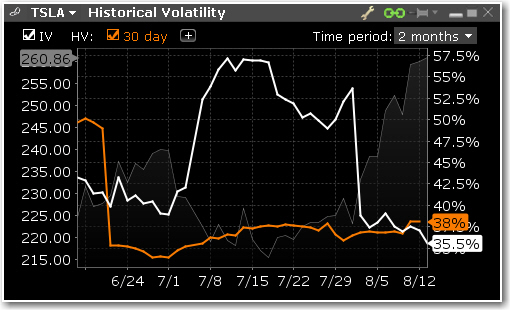
Historical Volatility
This plot defaults to the 30-day reading of both implied and historical volatility plotted against the share price over a custom period. By clicking on the plus arrow the user can select from an array of calculations to view historical volatilities. Investors may want to see how high and for how long volatility measures rise or fall when they suffer significant swings driven by aberrations to the trend for the underlying share price. The grey line in the background plots the reading for the underlying share price.
See the complete Volatility Lab.