Sections of the Risk Navigator interface are described below.
|
|
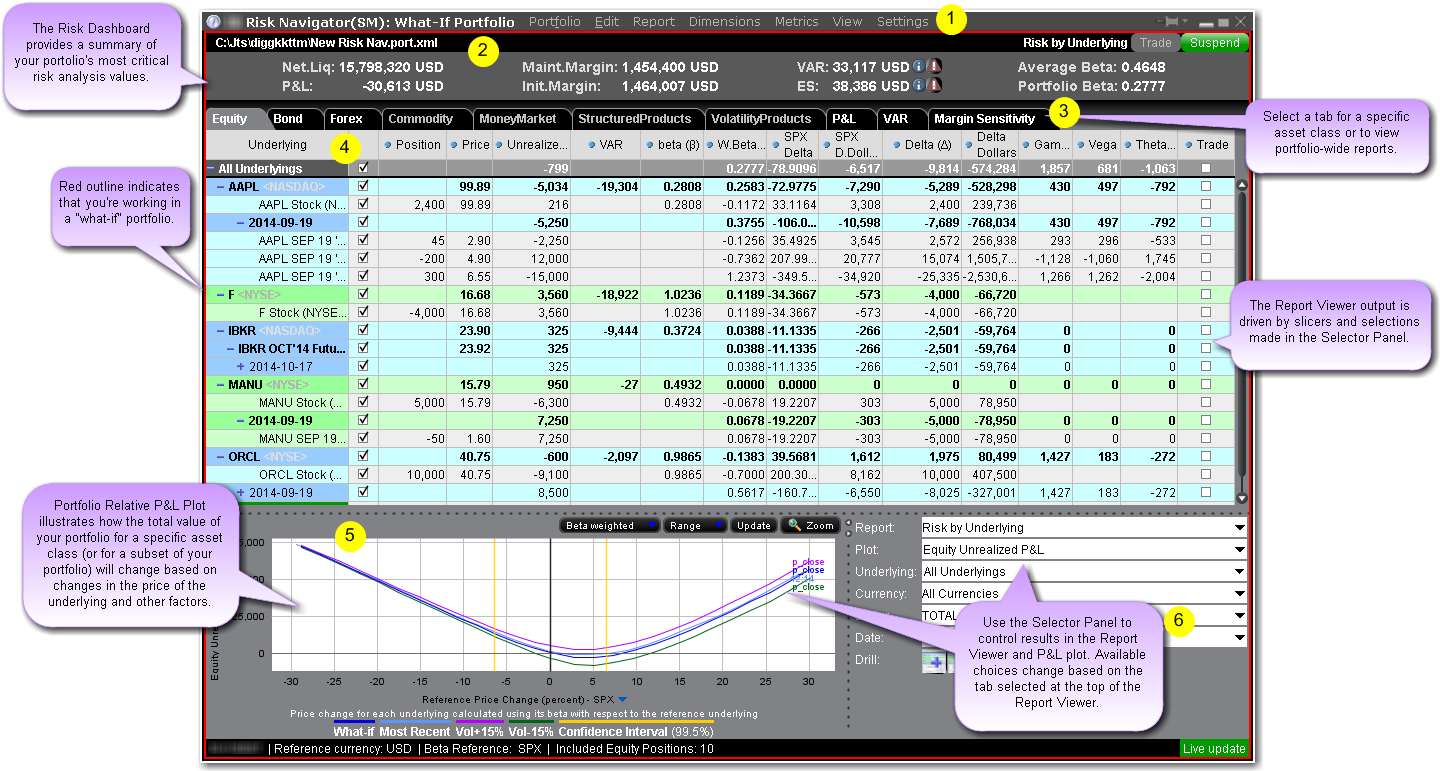
The title bar shows the portfolio name and type, and displays the menus. |
|
|
The Risk Dashboard provides a snapshot view of key account metrics. It is always displayed at the top of the interface above the Report Viewer regardless of the selected tab. |
|
|
The tabset list provides easy navigation between asset types and information sets. |
|
|
The Report Viewer displays data that is driven by selections in the Report Selector. It can be customized by adding and removing fields, resizing columns and resorting. The Report Viewer for each tab operates independently of all others; changes made to the Report Viewer for one tab are not reflected in viewers for other tabs. This means you will need to add desired fields to each Report Viewer. |
|
|
The Portfolio Relative P&L Graph illustrates how the value of your portfolio (or of the selected sub portfolio) will change based on percent changes in the price of the underlying. |
|
|
The Report Selector controls the output displayed in the Report Viewer and in the P&L Graph. Available selections in the drop down lists vary based on the selected tab. For example, reports displayed for the Equity tab may not be relevant in the Bond tab. |