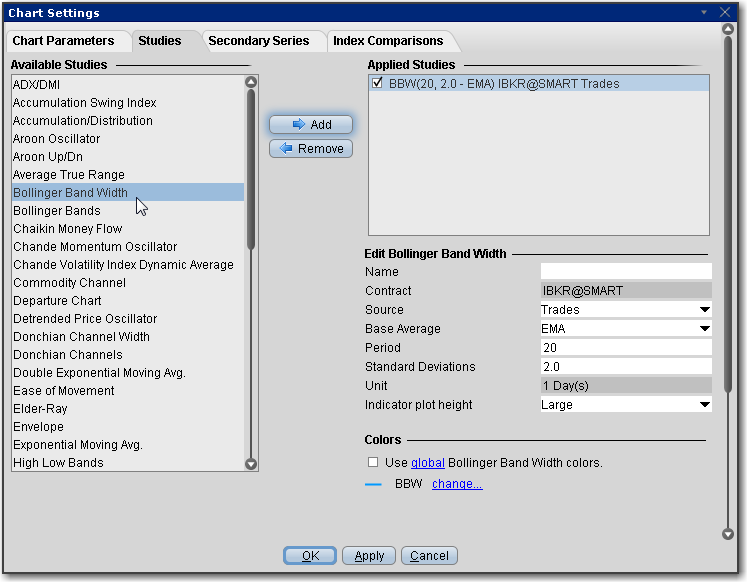
Bollinger Band Width is derived from Bollinger Bands and measures the percent difference between the upper and lower bands. It decreases as Bollinger Bands narrow and increases as Bollinger Bands widen. Because Bollinger Bands are based on the standard deviation, falling Band Width reflects decreasing volatility and rising Band Width reflects increasing volatility.
To apply a Bollinger Band Width Indicator
Once the study is defined, you can elect to uncheck/check to remove and add the study to your chart.