A technical momentum indicator that is created by calculating the difference between the sum of all recent gains and the sum of all recent losses and then dividing the result by the sum of all price movement over the period. This oscillator is similar to other momentum indicators such as the Relative Strength Index and the Stochastic Oscillator because it is range bounded (+100 and -100).
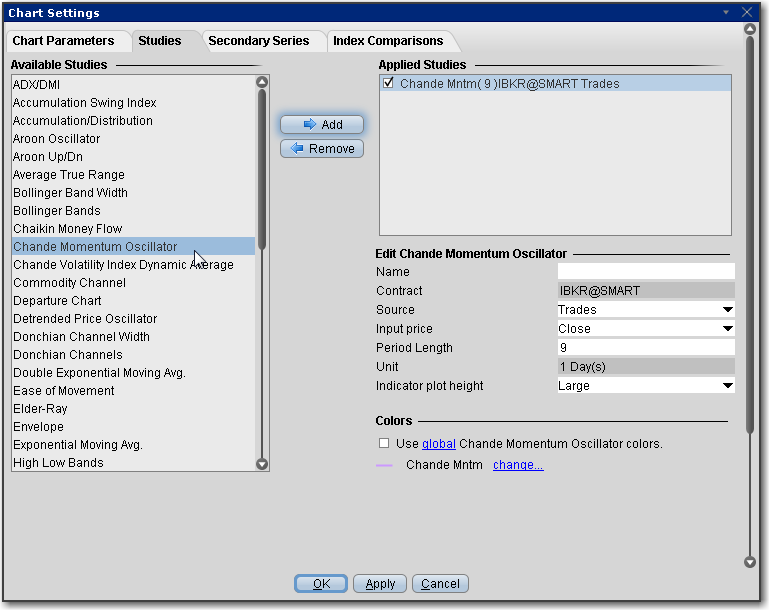
To apply a Chande Momentum Oscillator Indicator
Once the study is defined, you can elect to uncheck/check to remove and add the study to your chart.