The stochastic oscillator provides information about the location of a current close in relation to the period's high and low. It ranges between 0% and 100%. A reading of 0% indicates that the close was the lowest price at which the security traded during the preceding x number of time periods. A reading of 100% indicates that the close was the highest price at which the security traded during the preceding x number of time periods. The RSI version of this indicator in essence applies the stochastic calculation to the Relative Strength Indicator (RSI).
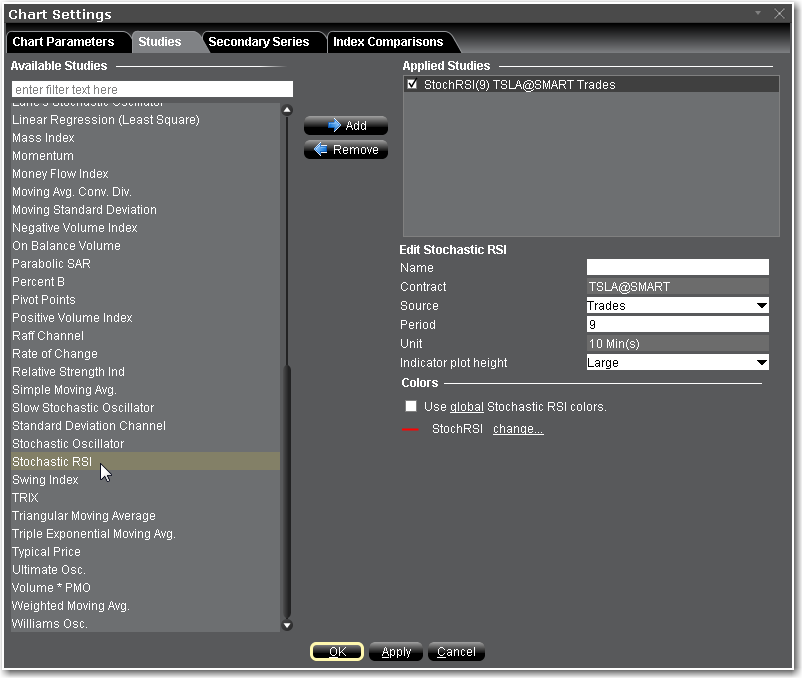
To apply a Stochastic RSI
Once the study is defined, you can elect to uncheck/check to remove and add the study to your chart.